-
Convenience Stores
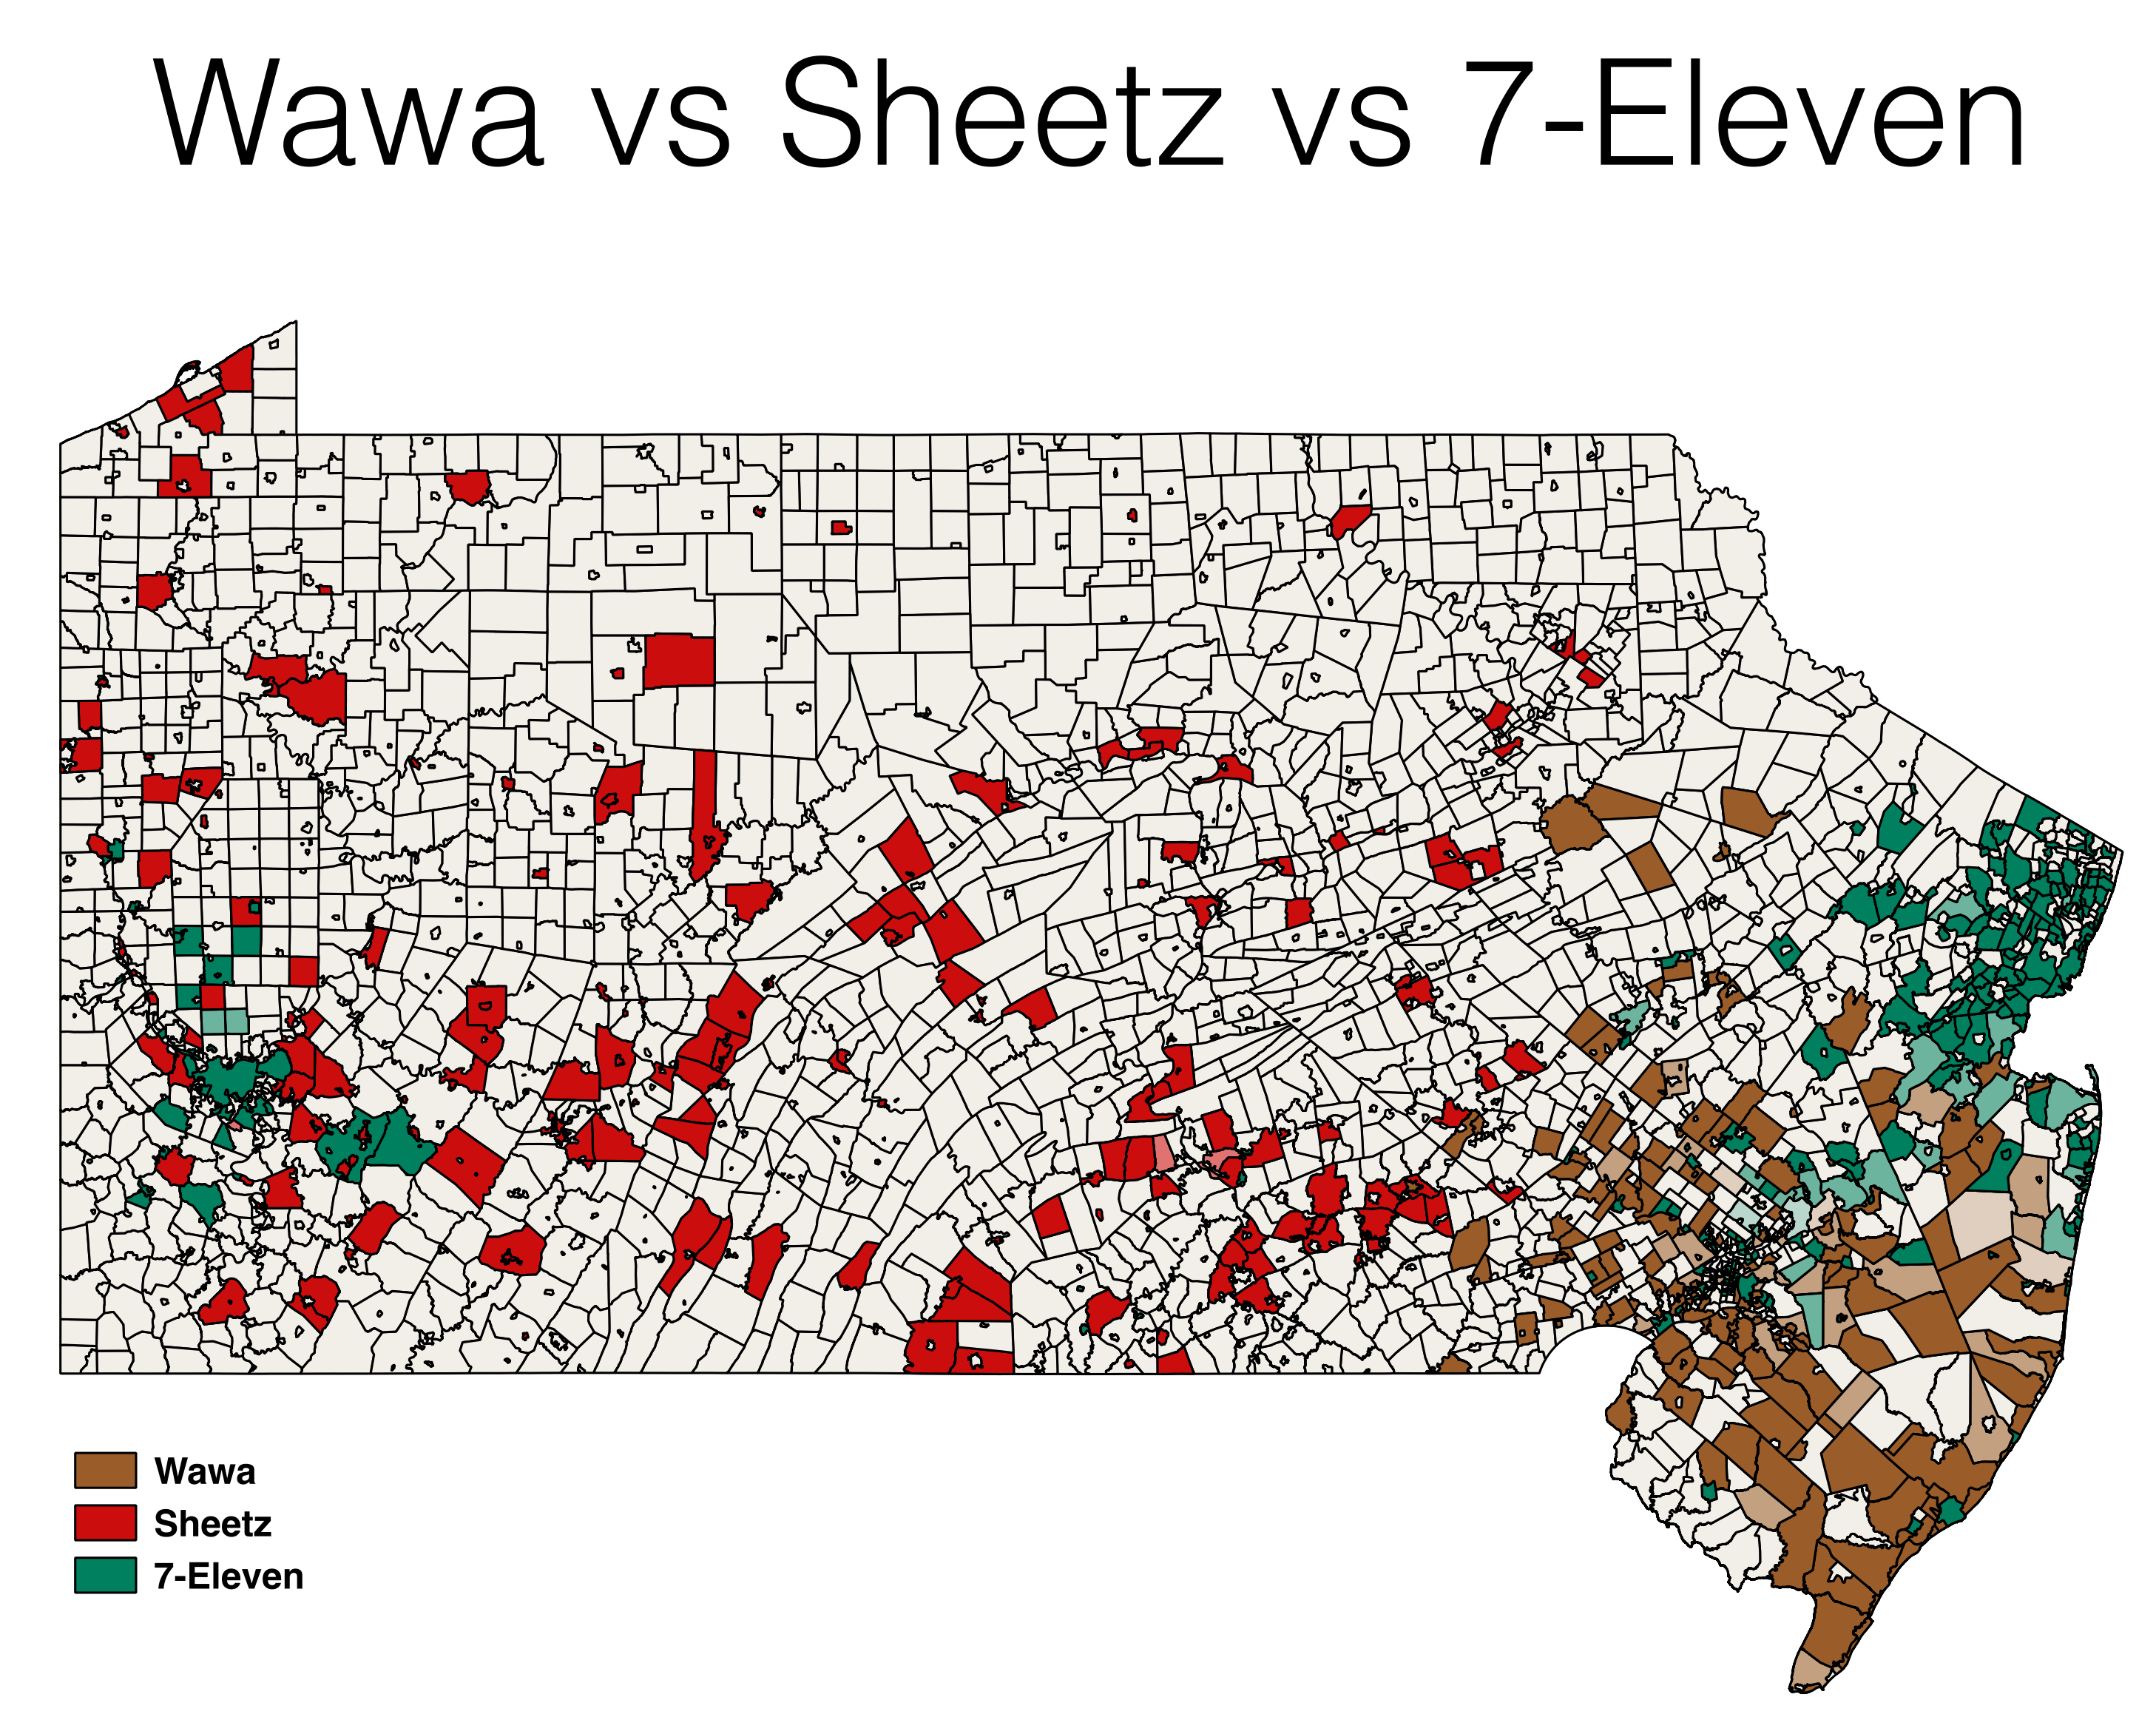
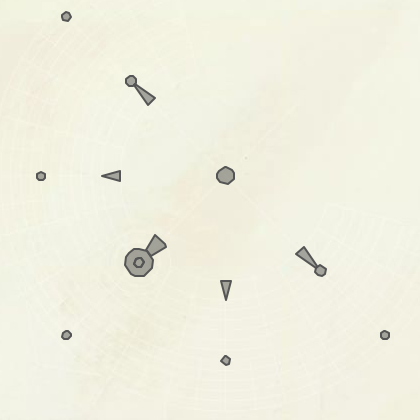
This map shows the distribution of Wawa, Sheetz and 7-Eleven locations in Pennsylvania and New Jersey. The darker the color the higher percentage of that store brand of all stores in that municipality. You can make out the north vs south divide in New Jersey. Sheetz clearly goes for rural Pennsylvania over urban which is dominated by 7-Eleven.
This was my first try at making a map in QGIS. It wasn’t easy but it eventually worked (until it crashed and lost my project 😩).
There’s a script to do the fetching if you want to mess with the data. But if your interested in a much more far reaching project to collect all the things check out Ian Dees’ effort. I’m excited to see what can be scraped out there.
-
YapDatabase Task Queue
In an attempt to make ChatSecure more asynchronous it needed a way to ensure messages are sent even if the conditions aren’t appropriate at the moment the send button is pressed.
In the past messages were sent over the XMPP stream and forgotten. We would block if the stream wasn’t connected and forced the user to connect manually. This isn’t great experience on mobile devices where network state can change. We wanted ChatSecure to behave more like iMessage. We also wanted to make sure we could guarantee that a message intended to be sent using OMEMO or OTR used the proper encryption method. This means in the case of OTR we need to create a session and ensure the contact is ready to receive the message. And for OMEMO we need to fetch pre-keys and prepare sessions with every device.
ChatSecure uses YapDatabase extensively to manage application state and storage (except for a few items in the key chain). YapDatabase recently added ActionManager but it wasn’t quite what we needed and the block API didn’t fit our needs easily.
Solution
YapTaskQueue allows us a single object that is able to handle sending all (text) messages on a first in first out persistent queue.
How it works
First the setup:
let database = YapDatabase(path: path)
let handler = //Some object that conforms to YapTaskQueueHandler
do {
	let broker = try YapTaskQueueBroker.setupWithDatabase(database, name: "handlerName", handler: handler) { (queueName) -> Bool in
        // return true here if it's a queue that this handler understands and 'handles'
        return true
}
} catch {

}
The handler needs to implement one function:
func handleNextItem(action:YapTaskQueueAction, completion:(success:Bool, retryTimeout:NSTimeInterval)->Void)After an action is complete just call the completion closure whether it was successful or not and if not how long before the queue should retry it. Since it’s a first in first out the queue blocks until the action at the tip is marked as completed or manually removed.
The queue itself automatically removes a task if it’s completed successfully.
Second create an action:
Then Create an object that conforms to
YapTaskQueueActionand save it to the database. This object should contain all necessary data to perform the action and know which queue it belongs to.class Action:NSObject,NSCoding { let actionKey:String let actionCollection:String let text:String let buddyId:String let date:NSDate ... } extension Action:YapTaskQueueAction { /// The yap key of this item func yapKey() -> String { return self.actionKey } /// The yap collection of this item func yapCollection() -> String { return self.actionCollection } /// The queue that this item is in. func queueName() -> String { return self.buddyId } /// How this item should be sorted compared to other items in it's queue func sort(otherObject:YapTaskQueueAction) -> NSComparisonResult { if let otherAction = otherObject as? Action { return self.date.compare(otherAction.date) } return .OrderedSame } }Conclusion
This setup is pretty straight forward and limits all the logic to handle an action to a single object. In our case this object knows how to prepare the necessary cryptographic session. It also confines the places that errors are handled and associated with a message.
Next Steps
We did run into some issues where one action was stuck in the queue and ended up blocking any other action in that queue. But this was resolved by better error handling. There were some error cases that weren’t properly being sent back to the queue handler.
It would also be great if the queue supported other methods like last in first out. In some situations you may not be interested in handling all actions sequentially. In this case it would be nice if the queue was concurrent.
-
Progress on OpenAddresses
OpenAddresses contains a large repository of addresses, 282,064,595 in total. For a while I’ve checked the growing list of included sources. I want to take a look at just the US sources and ask how many people are covered by the current set of data?
This also gave me a chance to try building a swift command line tool with the Swift Package Manager. OpenAddressesCensus is a simple tool that looks at a census csv file and the OpenAddresses repository and compares which counties have exact coverage, coverage from a state source or no coverage. If you’re interested on how it works check out the repository. One big assumption the tool makes a state level source contains all addresses in that state. It’s possible that a state source is incomplete and excludes some counties. I also manually marked the New York City counties as covered because they are so large and covered in a city level source.
Results
The best I can do right now looking at county level data is find a lower bounds on the population covered. For example I noticed there are a lot of counties in New York that are not marked as covered because there is no geoid in the New York State source. Although it appears the New York State source does not cover all counties. There are also quite a few city level sources that OpenAddressesCensus doesn’t handle yet. You can see Detroit, Austin are all big cities that aren’t counted in my population numbers yet.
So with that all in mind here are the results:
Population Population % Complete 203106631 63.2% State 46750056 14.5% None 71562133 22.3% That puts the lower bounds at 77.7% of the US population covered. That’s a lot better than I expected.
The 10 biggest counties missing are below. Every one of them has an own issue or is mostly covered by a city in that county. You can see the full list of missing counties in the OpenAddressesCensus results.
Missing Counties
- Wayne County, Michigan (partial coverage in the Detroit source)
- Suffolk County, New York (#579)
- Nassau County, New York (#1990)
- Travis County, Texas (partial coverage in the Austin source)
- Gwinnett County, Georgia (#2060)
- Pierce County, Washington (Related #1947)
- Montgomery County, Pennsylvania (#1982 & #1979)
- Oklahoma County, Oklahoma (#192)
- Cobb County, Georgia (#456)
- DeKalb County, Georgia (#460)
Next Steps
I want to make this tool more accurate. Right now it’s limited to county level population data. I could add city level population data and handle sources like the New York State that don’t have a geoid but rather a geometry. In both cases the tool needs to support finding the union of geometries covered and then finding the population within that geometry. That way it doesn’t double count overlapping sources from a city and a intersecting county.
-
What's new for the iBurn map in 2016
Burning Man is coming up soon and iBurn is ready for 2016.
Probably the biggest difference this year is the city didn’t move. It’s in exactly the same place it was last year.
The Map
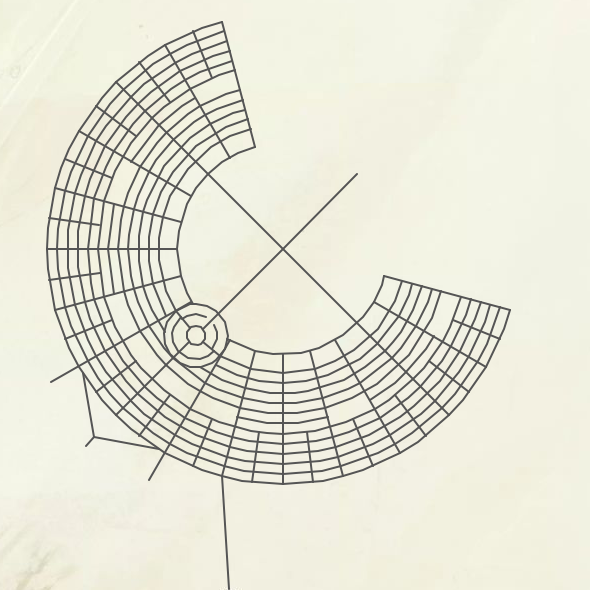
Generating Streets Like a Grid
Last year I realized I had a pretty big problem with geocoding some intersections. Whenever a time street (2:00, 10:00, …) ended it never perfectly matched up with the lettered street (A, B, …) because they didn’t share a node. They were always off by an extremely small amount and they never came back as intersecting. So I realized I needed to create common points between all roads that intersected (this ended up helping the OpenStreetMap import as well).
So what I ended up doing was treating the streets like a grid. So instead of creating a bunch of lines and outputting the GeoJSON. We create a bunch of points in the grid with axis being bearing and distance. After creating points for every road we can go back and collect the points to create the GeoJSON lines. This ensures that instead of 2:00 just having a start and end point it contains all the points where a street intersects or meets it.
Toilets
For this year I wanted to make the toilets more legible. So I needed to make toilets polygons instead of just points. In the past we never generated our own toilet locations but got them from other people who were kind enough to share.
Following the design from last year I decided to make a layout file just for toilets.
{
  "size":[50,200], //The size of the toilet rectangle in feet.
  "location": [
    {
      "bearing":50,        // The bearing from the man in degrees, time, or array of times.
      "offset":24,   	   // The offset from bearing in feet. to move it off of intersection or road.
      "distance":3000,     // The distance from the man in feet, single street, or range of streets.
      "orientation":"city" // The orientation of the rectangle options are city, center or perp.
    },
    {
      "bearing":"3:00",
      "offset":-160,
      "distance":1200,
      "orientation":"city"
    },
    {
      "bearing":["6:30","7:00","8:00","8:30","9:00","9:30"],
      "offset":45,
      "distance":["h","i"],
      "orientation":"center"
    },
    ...
    ]
}
This gets fed into the toilet parser along with the overall city layout. The result is both points and polygons of all the toilets at Burning Man.
Plans for 2017
There are few things I think would make next year even easier.
- Generate our points file. This includes first-aid, ranger, bus stops, ice locations.
- Automatic generation of GeoJSON files every time the scripts or layout files change.
- Expand the features we map like walk-in camping and other infrastructure.
- Vector tiles!
Let me know if you see any errors with the map.
-
Making the iBurn Map: Geocoder
Creating a reverse and forward geocoder was the most experimental feature this year. One of the goals of the geocoder was to be able to run them on the device without an internet connection. We also wanted to run it both on Android and iOS. Since all the past work was done with javascript it seemed logical to stick with javascript. But because I wanted to run on both platforms it made it so I couldn’t use things like spatialite without a lot of effort and learning C++. There are definitely more efficient ways to make local geocoder so any hints on how to make it better are welcome.
Forward Geocoder
The main purpose for the forward geocoder was taking the playa address provided by Playa Events and turning those into latitude and longitude coordinates. There are two address types for the playa. The easiest and most accurate is time and distance i.e.
4:25 & 800'. The second are street intersections i.e.7:30 & Arcade. This type is a lot less accurate because it only gives you the nearest intersection not the actual location of the camp.The first step for the geocoder is to prepare the data. I take the streets geoJSON file and other polygon features and load them into a large features array. Once there’s a request to reverse geocoded it’s put through some regex to figure out which type of address it is. If it’s a time and distance then I figure out the angle of the time and use turf-destination to get the lat long. If it’s a street intersection. I find the best match using levenshtein to a feature and once I have the best two matched features I find their intersection with each other using turf-intersect.
Improvements
I noticed that streets on the ends like 2:00 and 10:00 don’t always intersect. This year I just tried using radial streets off by + or - 1/20 of a degree. I could instead ensure that the streets share points to guarantee a result when checking if they intersect.
This year we didn’t handle plaza addresses. This is the case where the plaza has an internal clock to locate camps along the outer edge.
Reverse Geocoder
We got a feature request from a Ranger telling us that it would be helpful to know where they were on the playa not latitude and longitude but something they could say over the radio and have another Ranger understand. I first categorized a few different places you could be.
- Center Camp Plaza
- Café
- The city streets area
- Inner Playa
- Outer Playa
- Outside Black Rock City
For the Center Camp Plaza or Café I just returned the name of the feature. In the future I should probably do this for all plazas and portals. The city streets area first detected the nearest non-time street. This was done in a pretty naive way by sorting a large array of all the features. If the closest match was part of Center Camp then we calculated the time based on the Center Camp Center but for all others we calculated the time based on the Man. So results would look like
8:26 & Arcade. For Inner and Outer Playa I used time and distance as the address. This was easy to calculate as all was needed was to convert the angle to the man then convert that to clock coordinates and then find the distance between the man and the point.Geocoder on device
Preparation
To get the geocoder ready for use on the device I used browserify to package up all the js necessary.
browserify index.js > bundle.jsWe also did some uglifyify to get it a bit smaller. You can find all the code on Github.
iOS
We created a small wrapper class around JavaScriptCore. Apple makes it really easy to pass between Objective-C and JS. Loading the JS:
NSString *path = [[NSBundle mainBundle] pathForResource:@"bundle" ofType:@"js"];

NSString *string = [NSString stringWithContentsOfFile:path encoding:NSUTF8StringEncoding error:nil];
string = [NSString stringWithFormat:@"var window = this; %@",string];

strongSelf.context = [[JSContext alloc] init];

[strongSelf.context evaluateScript:string];
[strongSelf.context evaluateScript:@"var reverseGeocoder = prepare()"];
Then to execute a query:
- (NSString*) executeReverseLookup:(CLLocationCoordinate2D)location {
    NSString *command = [NSString stringWithFormat:@"reverseGeocode(reverseGeocoder, %f, %f)", location.latitude, location.longitude];
    JSValue *result = [self.context evaluateScript:command];
    NSString *locationString = [result toString];
    return locationString;
}
Android
I wasn’t part of implementing the android but if you’re used to look at Java take a look here where it’s setup. We were able to execute ths javascript in an off screen web view.
-
Making the iBurn Map: Results
This is the final post in a series on making the data for iBurn 2015. So far we’ve created the streets and polygons. The last few pieces are making the ‘outline’ of the entire city and a few points of interest.
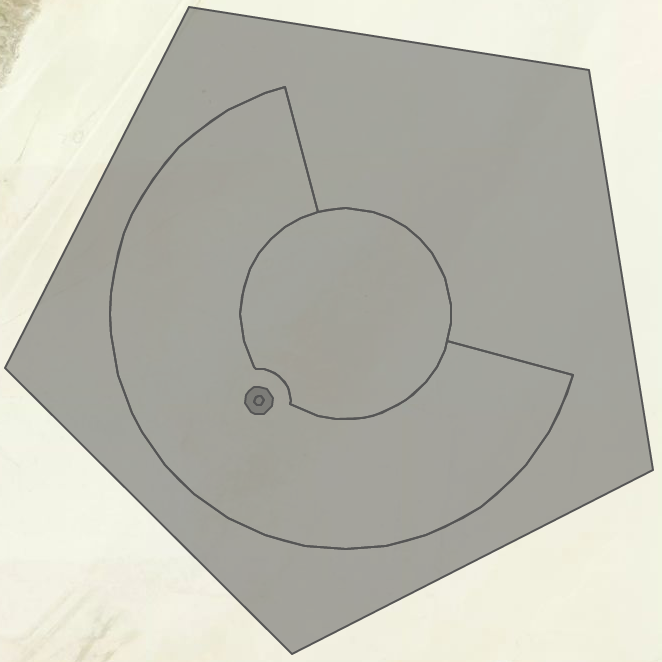
Outline
The Golden Spike
csvhas the street widths so we are able to create polygons from the street lines usingbufferfrom jsts.sreets.features.map(function(item){ var geo = reader.read(item).geometry; var width = defaultWidth; if (item.properties.width) { width = item.properties.width; } //Convert width in feet to radius in degrees radius = width / 2 / 364568.0; var buffer = geo.buffer(radius) buffer = parser.write(buffer); var newBuffer = { "type": "Feature", "properties": {} } newBuffer.geometry = buffer; if (outline) { outline = turf.union(outline,newBuffer); } else { outline = newBuffer; } });Now that everything is a polygon, streets, plazas and portals, we combine all the polygons into one large polygon. Once we get to the rendering out to tiles this will make it look really nice instead of layering the plazas or portals above or below the streets. We still need the street lines for creating the labels during rendering.
Points of Interest
I didn’t spend much time this year improving our POI data set. I relied on William’s data for the location of toilets. This data doesn’t change much year to year so just moving them depending on how the city moves as a whole works for us. I did the same thing with the other POI, ice, first aid and ranger stations. The only major difference this year is the added first aid stations which were estimated based on this map.
My plan for next year is to really improve the POI for the next year. Fingers crossed that Playa Events will even include latitude and longitude int their API.
The Final Map
We used the same process as other years and created a bunch of png tiles and packaged them up into an mbtiles file using Tilemill. Next year we hope to use vector tiles as long as MapboxGL has mbtiles support.
-
Making the iBurn Map: Polygons
This is the second part of in a series on how the data was created for the 2015 iBurn map. I would suggest you read making the streets first.
Plazas
The simplest polygon are the plazas. There are two pieces of information needed to create a plaza, the center and the diameter of the plaza. The diameter of the plazas is published in Burning Man’s Golden Spike information. Then in the
layout.jsonfile we capture the the distance from The Man, either a street or in feet, and the time angle. From this we can derive the center point. Using the same function from creating streets we can create a circle around the center.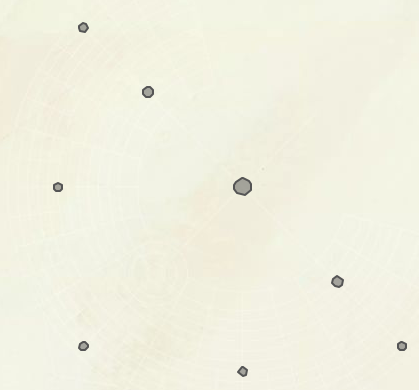
Center Camp Plaza
The Center Camp Plaza is a little trickier because the Café is right in the middle. Looking at previous years satellite imagery and other pdf maps I was able to estimate that the the Café structure has a 110’ radius. So it’s easy with geoJSON to describe a polygon with ‘holes’ so we just add the Café polygon as a hole to the larger Center Camp Plaza.

Portals
I was really excited to add portals to our map this year because it really helps to orient yourself out on the desert. I wanted to get the portals as accurate as possible so I looked at past satellite imagery to try to understand their dimensions. From the imagery they seemed pretty consistent starting at a particular street intersection and expanding towards The Man, terminating at either Esplanade or Rod’s Road for the Center Camp Portal. I estimated the angle to be about 20 or 30 degrees depending on the portal.
To create the portal first I create an angle starting at the intersection with edges a 1/2 mile opening up towards The Man. Then I took Esplanade (for 6:00 portal Rod’s Road) street and ‘cut’ the angle’s edges. To cut cut the angle I used the jsts difference function. Then you have a portal!

The problem is that 9:00, 3:00 and 6:00 portals overlap their plaza. I decided that the plaza was the more defining feature at that point so I cut those portals again with the plaza so there wasn’t any overlap for the renderer.


Results
-
Making the iBurn Map: Streets
I worked with Andrew Johnstone, Savannah Henderson, David Brodsky and Chris Ballinger making the iBurn app for Android and iOS. One of my favorite features in iBurn is the map when you first launch the app. This year I took on rewriting and rethinking how we create the geo data. I’m going to try and document how I made the different components of the map.
Components of the map
- Streets
- Plazas & Portals
- Points of Interest (toilets, ranger stations, etc.)
Streets
Everything we do starts with the Golden Spike which fortunately is published fairly far ahead of time. There’s tons of useful information in the
csvbut for streets we need the distance each circular street is from the man and the names for this year.MARCR,2940,"Man to ""A"" Road Center Radius" ... ARN,Arcade,"""A"" Road Name"This format was not the best to work with directly so I took what I needed and added some other data to a JSON file I called
layout.json. The purpose of the layout file is to contain all the data necessary to create the city layout. So to make the map for 2014 or any other year just update the layout file.Circle & Time Streets
The format is a a bit strange but here’s a sample for the circular streets.
"cStreets":[
    ...,
    {
      "distance":2940,
      "segments":[["2:00","10:00"]],
      "ref":"a",
      "name": "Arcade"
    },
    {
      "distance":3180,
      "segments":[["2:00","5:30"],["6:30","10:00"]],
      "ref":"b",
      "name": "Ballyhoo"
    },
    ...
]
One of the biggest benefits of the JSON format is I can capture the fact that not all streets start at 2:00 and go to 10:00. So it’s easy for B and F streets to be created correctly. We’ll handle Center camp separately.
The time streets are the same each year. So I used past PDF maps and past satellite images to figure out their configuration. Because there’s so much repetition with the time streets I changed the format a bit.
"tStreets":[
    ...
    {
      "refs":[
        "2:00",
        "2:30",
        "3:30",
        "4:00",
        "4:30",
        "5:00",
        "7:00",
        "7:30",
        "8:00",
        "8:30",
        "9:30",
        "10:00"],
      "segments":[["esplanade","l"]]
    },
    ...
]
Now once everything is in the layout file there are only a few scripts need to make the geoJSON files that will be used to make the map. I used Turf.js for all the geo calculations. Turf worked really well in our case and made it so I didn’t have to do any geo math… ever.
In order to create the arc or circular streets I just dropped a point every 5 degrees going from the start of a segment to the end.
var currentPoint = turf.destination(center,distance,currentBearing,units);
points.push(currentPoint.geometry.coordinates);
Then just collect all the points into a
MultiLineStringwith the correct properties from the layout file.The time streets are done in a similar way. Using Turf and
turf.destinationto calculate the correct start and end points. There are a few functions inutil.jsthat help to convert from Playa time to degrees (with a bit of math).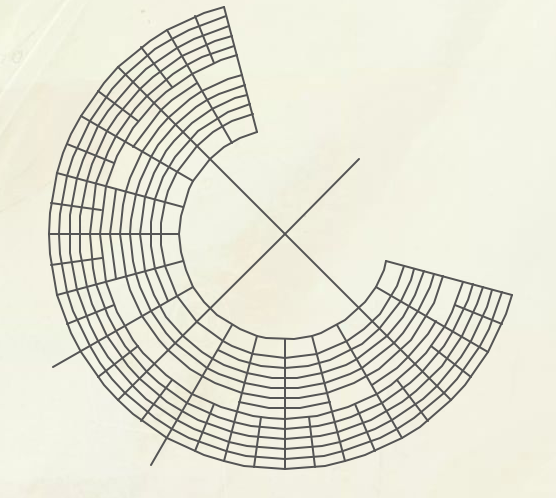
Center Camp
The trickiest part is creating Center Camp and cutting out the other streets that would ordinarily cut through Center Camp. There are a few components of center camp.
- Rod’s Road
- A Road
- Center Camp Plaza
- Route 66
- 6:00
Rod’s Road is the easiest. Once we find the center of Center Camp we just use the same arc function to create a full circle around that point. And the same goes for the Center Camp Plaza Road which is just half way between the edge of the Café and the outer edge of the Center Camp Plaza.
The A road which goes into Center camp is a actually a straight road not an arc from Rod’s Road to the Center Camp Plaza Road. So we calculate where A Road and Rod’s Road intersect, create a line from there to the center of Center Camp and then ‘cut’ that line with the Center Camp Plaza Road. We also cut 6:00 with the Center Camp Plaza Road. All the Cutting was using jsts difference method.
Once we have the two A Road segments through center camp we find the bearing of each and create arcs for Route 66, a service road between Rod’s Road and Center Camp Plaza. And then for the segment of Route 66 on the man side we cut that with the 6:00 portal.

Finally I cut the other arc and time roads with Rod’s road and combine them into a single geoJSON file. All the code for creating the streets can be found here. Or by just running:
node layout.js -f ../../data/2015/geo/layout.json -t streetsResult